Your first report
In the next few minutes you will scaffold a report bundle, preview it live in your browser, and export a PDF — the core loop you will use every day with bino.
This guide assumes you have bino installed and available on your PATH.
-
Create a new workdir
A workdir is the root directory of a report bundle. Run
bino initto scaffold a new project:bino initbino initasks a few questions — target directory, report name, title, language — then generates the starter files. Use-y/--yesto accept defaults non-interactively.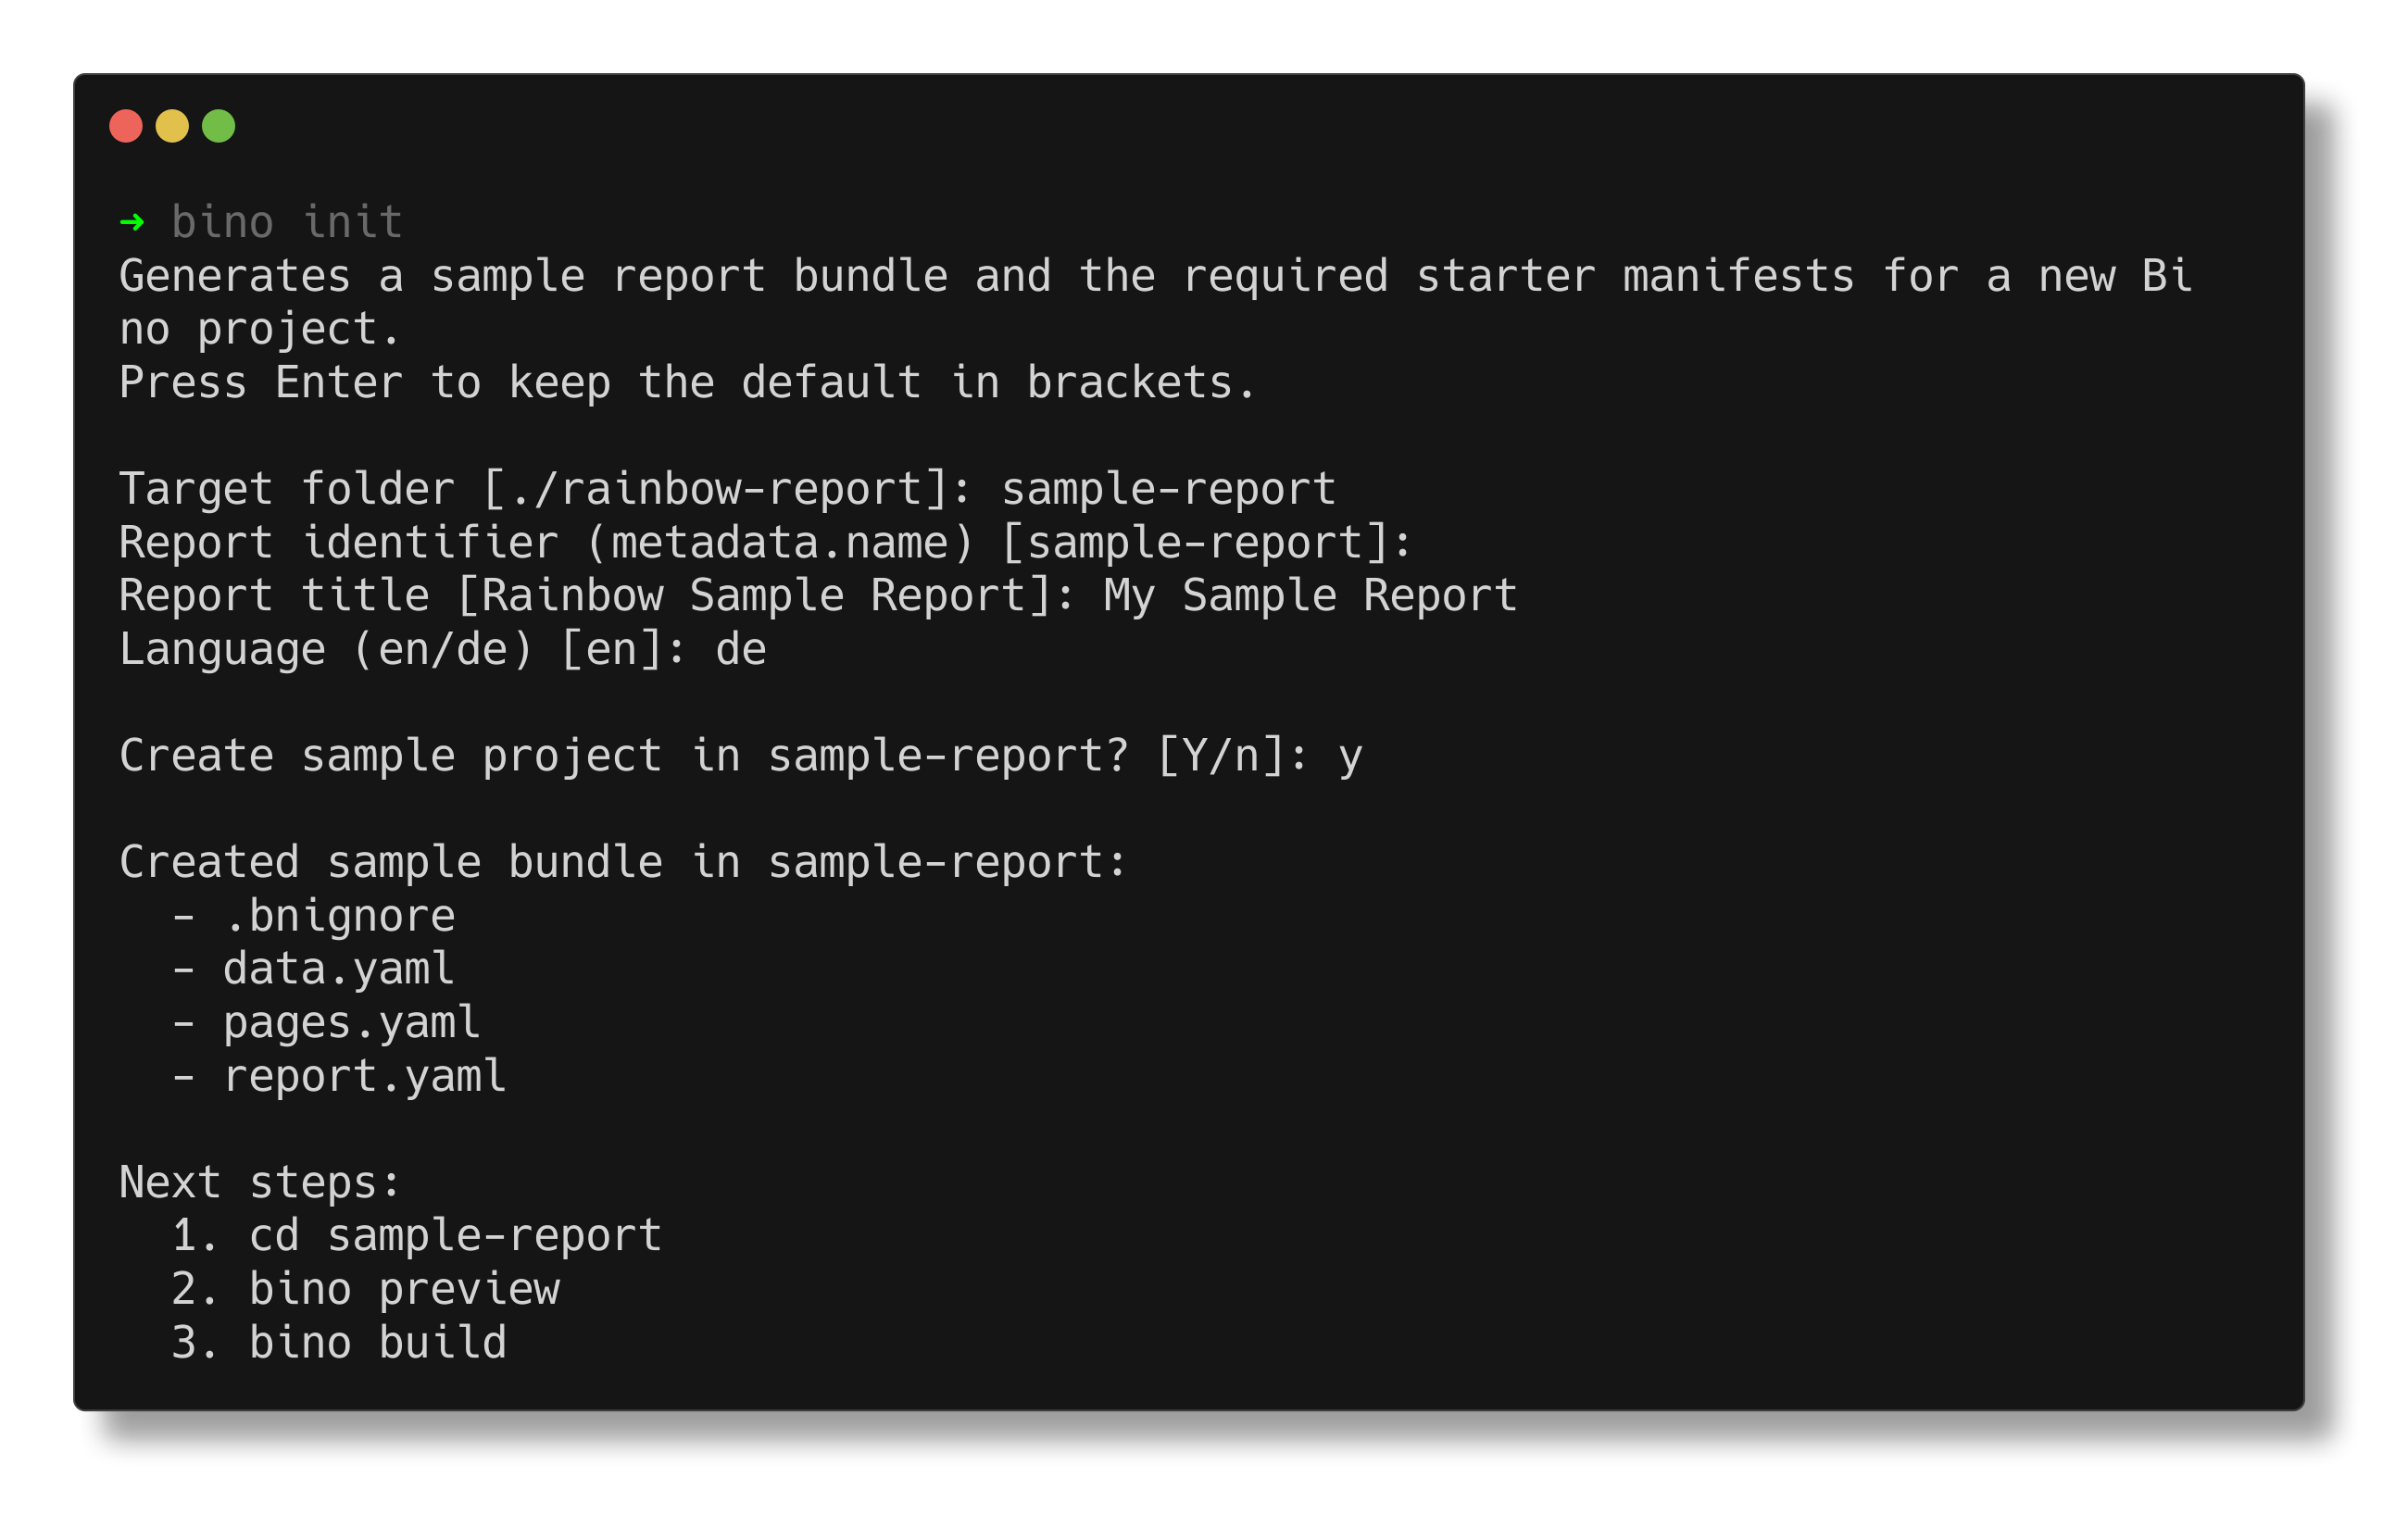
-
Inspect the generated files
Navigate into the newly created directory:
cd rainbow-reportThe scaffolded workdir contains everything bino needs:
File Purpose bino.tomlProject root marker and configuration data.yamlDataSource (loads raw data) + DataSet (SQL query) pages.yamlLayoutPage — page layout with child components report.yamlReportArtefact — assembles pages into a PDF Each manifest shares the same envelope:
apiVersion: bino.bi/v1alpha1and akindthat tells bino what role the document plays. See Key ideas for the full mental model. -
Preview the report
Start a live preview server from the workdir:
bino previewbino scans the directory for manifests, starts a local HTTP server (by default
http://127.0.0.1:45678/), and opens your default browser. As you edit YAML or data files, it reloads the preview automatically. -
Build a PDF
When you are happy with the preview, export a PDF:
bino buildbino validates manifests, executes datasets in the embedded query engine, renders HTML, and converts pages to PDF. Output goes to
dist/by default.Open
dist/rainbow-sample-report.pdf— you should see the chart rendered with your data: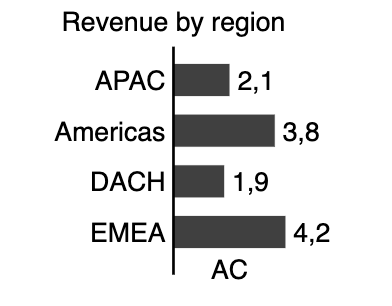
Example using a custom output directory:
bino build --out-dir dist/reports -
Export component screenshots (optional)
Besides PDFs, bino can capture individual components as PNG or JPEG images using
ScreenshotArtefact. This is useful for embedding charts in presentations, dashboards, or documentation.Add a
screenshots.yamlfile to your workdir:apiVersion: bino.bi/v1alpha1 kind: ScreenshotArtefact metadata: name: chart_export spec: filenamePrefix: export format: xga scale: device refs: - kind: ChartStructure name: revenue_chartRun
bino buildagain. Alongside the PDF, you will findexport-revenue_chart.pngin the output directory — a crisp, retina-resolution image of just that chart.See ScreenshotArtefact reference for all options including JPEG output, indexed filenames, and transparent backgrounds.
What you just built
Section titled “What you just built”You created a complete report bundle: a data source feeds into a SQL query, the query powers a chart, and a layout page composes it into a PDF. This is the Reporting as Code workflow — everything is a text file, everything is reproducible, and the same bino build command works on your laptop and in CI.
The images on this page were themselves generated by bino’s ScreenshotArtefact — the same tool you just learned about.
Where to go next
Section titled “Where to go next”- Learn about workdirs and manifests.
- Explore the schema reference to understand each
kindin detail. - Browse how-to guides for common tasks like connecting CSVs, databases, and styling layouts.
- See Recipe: CI/CD pipeline to automate builds in GitHub Actions or GitLab CI.
- Read Recipe: Monthly client report for a full end-to-end SaaS reporting example.