ChartStructure
ChartStructure manifests describe charts that show categories, groups, and variances.
They work on datasets with category-style dimensions and scenario-style measures.
Minimal definition
Section titled “Minimal definition”The smallest well-formed ChartStructure sets the required spec.dataset plus the
fields that make the ranking readable: a chartTitle, the aggregation level, the
sort key and direction, and the compared scenarios with their variance. Level, order
and scenarios auto-detect when omitted, but the detection depends on the dataset and
emits a build warning, so pinning them keeps the chart stable.
All attributes are listed in the Attribute Reference below.
Bars are drawn side-by-side by default; set stack to stack them instead (see
Stack configuration), and scenarios, variances, order
and orderDirection can be inherited from the surrounding layout (see
Inherited props).
Fields
Section titled “Fields”dataset- required; a dataset name, an inline dataset definition, or an array of those.chartTitle- optional custom title.filter- optional filter expression.level- aggregation level:rowgroup,category,subcategory, one of the index variants (rowgroupindex,categoryindex,subcategoryindex- keep the original dataset order instead of sorting), orauto. When set toauto, the level is detected from the dataset silently. When omitted, it is detected with a warning.order/orderDirection- sort key and direction; if you use a scenario, it must appear inscenarios. Whenorderis set toauto, it is detected from the dataset silently. When omitted, it is detected with a warning.measureScale- SI prefix (_,k,M,G, … orGREATEST/LEAST).measureUnit- unit string, for examplemEUR.unitScaling- data units displayed per 1 em of bar width (map-scale semantics: larger value = smaller bars),autoto fit the available width, or the name of a ScalingGroup. Unset or invalid values auto-fit with a warning that reports the resolved value.percentageScaling- percentage points per 1 em of bar length for relative variances (10→ a +10 % bar is 1 em long); sameauto/group-name options.- When
unitScalingis set to a numeric value and bars exceed the available container width, an overdrive bar is rendered: the bar is visually split into a base section, a zigzag break indicator, and a proportionally scaled overdrive section beyond it. This preserves value labels and relative comparisons between overflowing bars instead of clipping them. AC scenario bars break at a wider point than non-AC scenarios (PP, FC, PL) to maintain visual hierarchy. showCategories,showMeasureScale- visibility flags.limit- maximum bars per group; rows beyond the limit are cumulated as REST.pixelPerUnit- explicit scaling override.scenarios- list of scenarios (up to 4); values areac1-ac4,fc1-fc4,pp1-pp4,pl1-pl4. When omitted, they are detected from the dataset with a warning.variances- list of variance definitions of the formd<scenarioB>_<scenarioA>_[pos|neg|neu].scale- proportional scaling of the chart (font size, spacings, and bar lengths all scale together). Scaling triggers on height overflow (vertical category labels cut off).- omitted - auto-scale to fit the parent height; emits an
AUTO_scalewarning with the applied factor. An empty string is not a valid value. "none"- no scaling; render at the base font size regardless of available space."auto"- auto-scale to fit the parent height silently (no warning)."0.5","1.2", … - fixed factor applied to the base font size. All dimensions scale proportionally.
- omitted - auto-scale to fit the parent height; emits an
stack- optional object to enable stacked bar rendering:by- (required) stacking dimension:scenariosstacks scenario slots end-to-end;dimensionsauto-derives the stack column from thelevelprop (rowGroup→category,category→subCategory). When usingdimensions, only the first scenario is used; additional scenarios are discarded with a warning.mode- stacking mode:absolute(additive, default),relative(100% stacked), orabsolute-relative(absolute height with percentage labels).order- segment order within each stack:asc,desc, ordataset(default). Withby: scenariosandorder: dataset, segments stack in the order given inscenarios.
selectedStyle- optional name of aComponentStyleto apply; merged over the_systemand_defaultstyles.ruleset- optional name of aRuleSetto apply, orinherited-closest/inherited-pageto inherit the surrounding layout’s rule set; merged over the_systemand_defaultrule sets.
Example: Top 10 regions with variance
Section titled “Example: Top 10 regions with variance”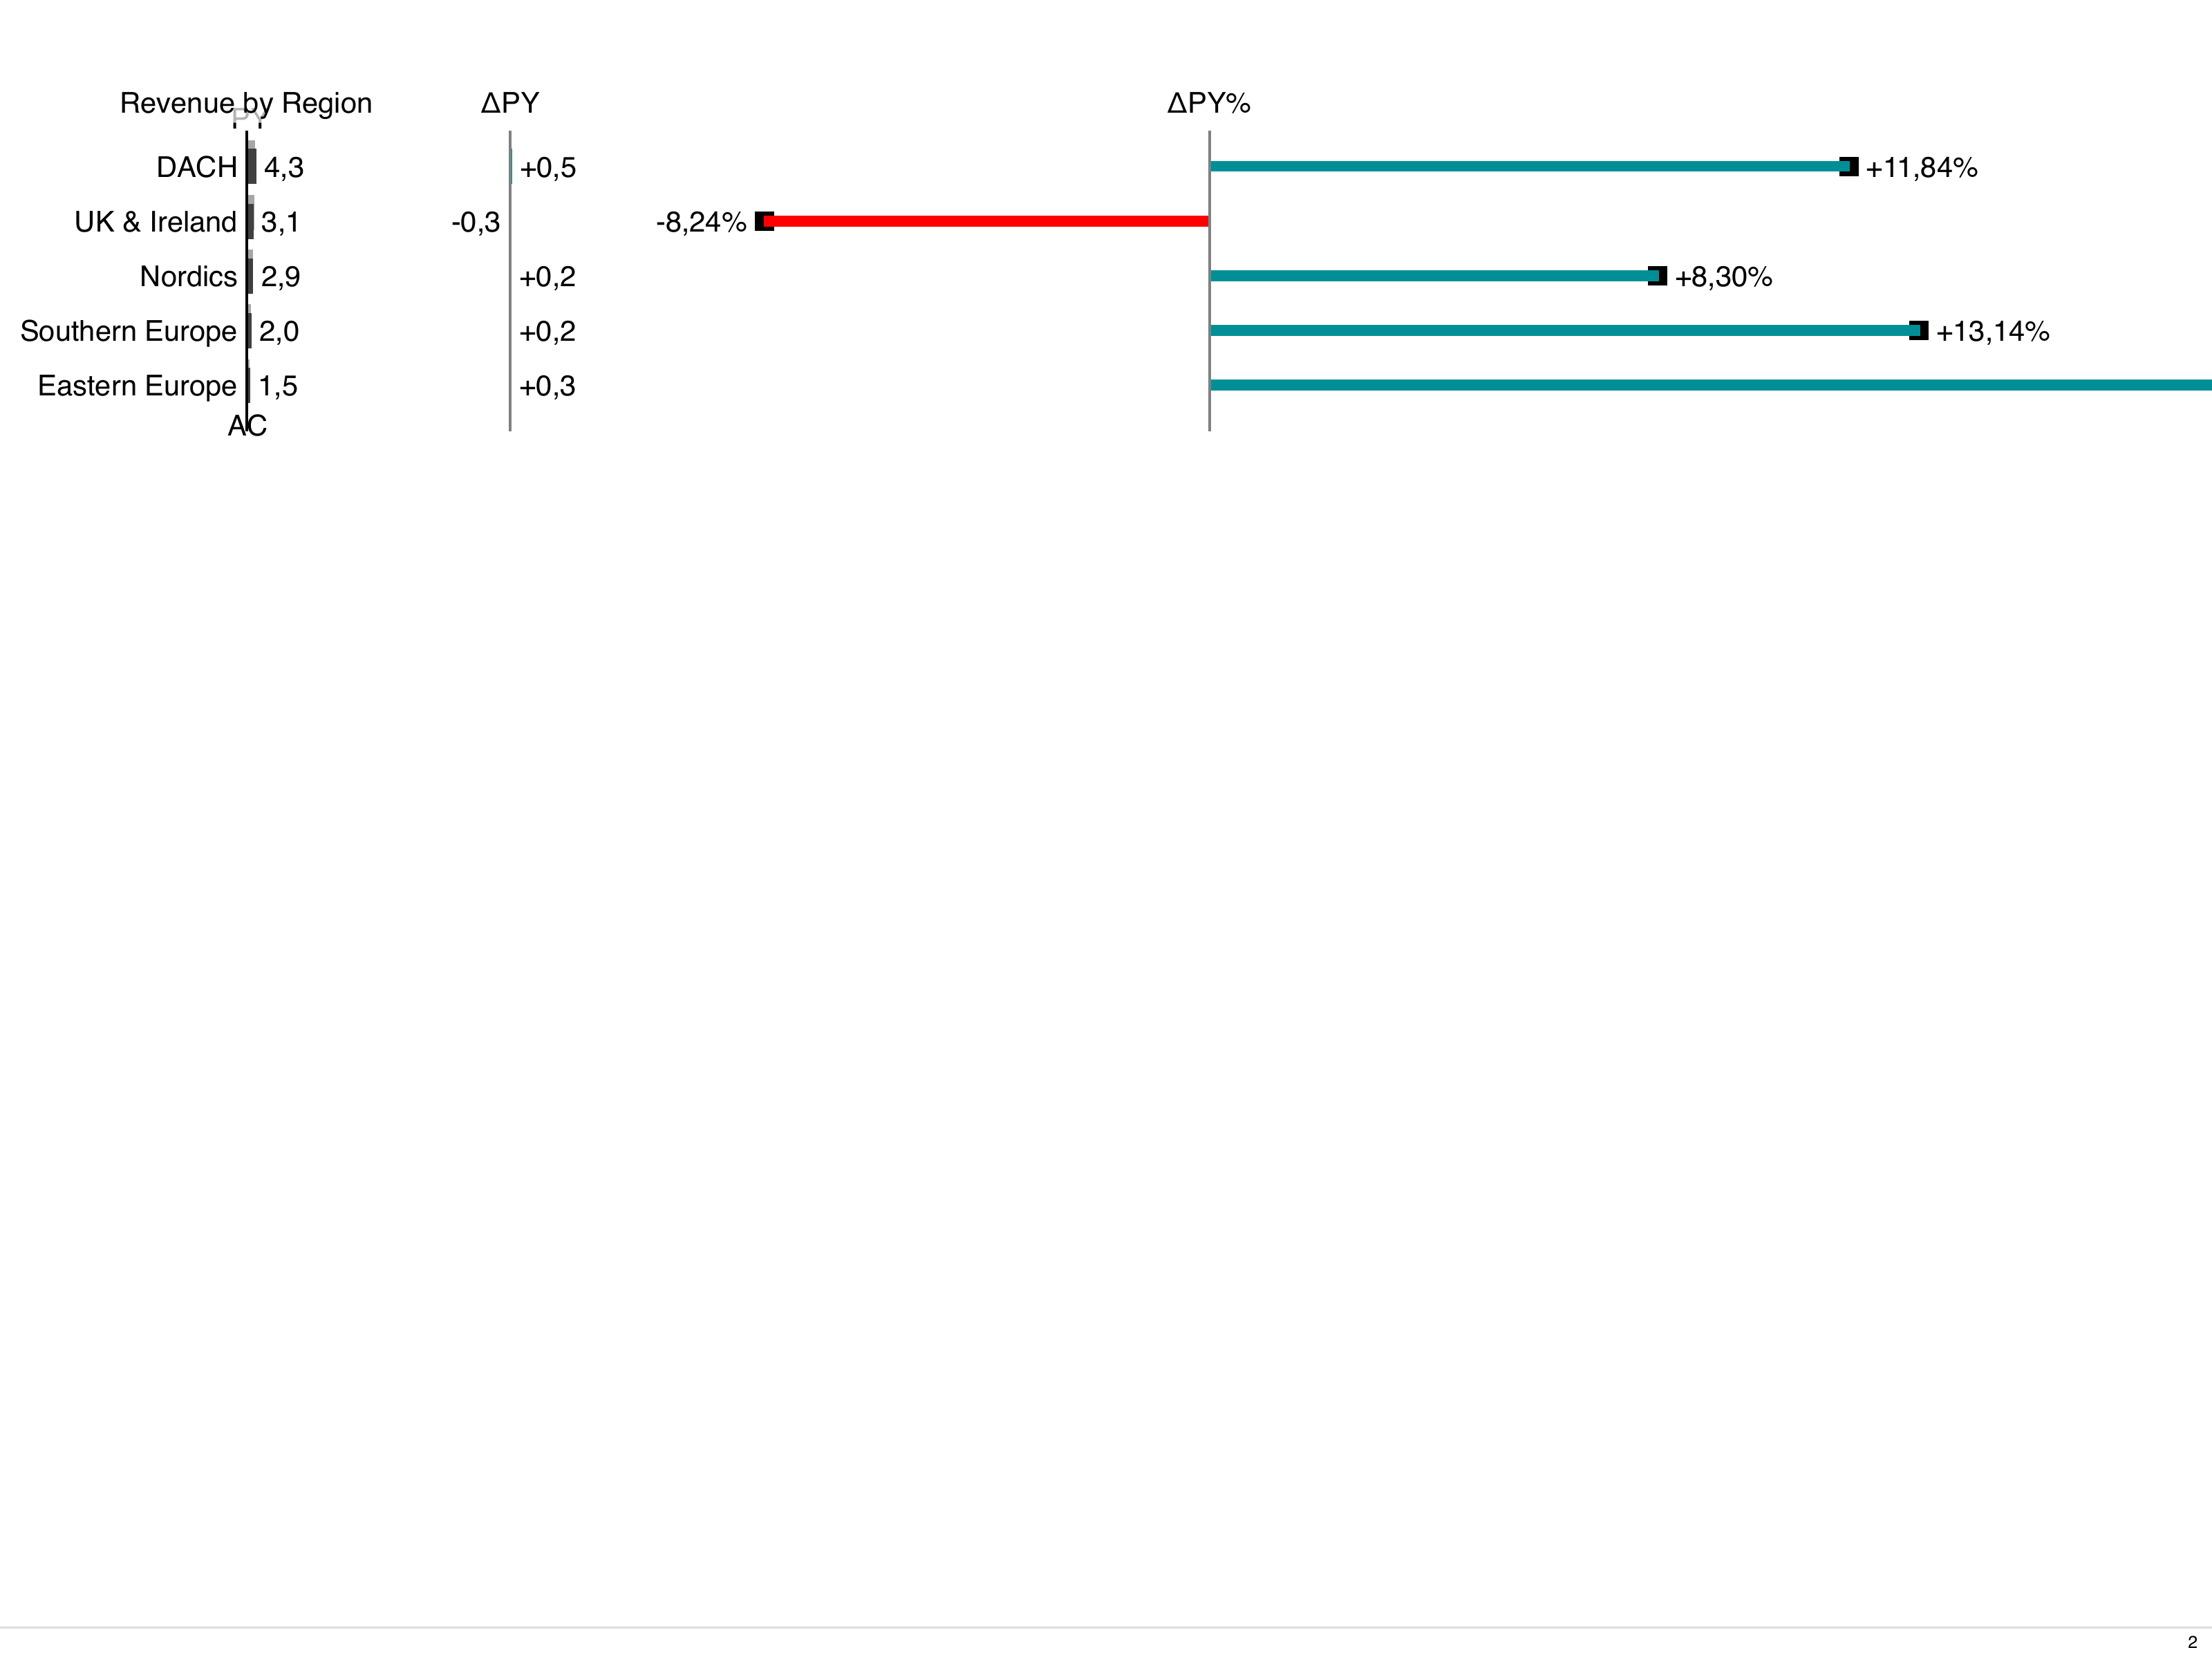
Example: Stacked bars by scenario
Section titled “Example: Stacked bars by scenario”Stack AC and PP as horizontal bar segments:
Overdrive bars (overflow handling)
Section titled “Overdrive bars (overflow handling)”When unitScaling is set to a fixed numeric value (not auto), bars may exceed the
available container width. Instead of silently clipping the bars, the renderer applies
overdrive rendering:
- Base section - the bar is drawn up to a computed cut width that fits within the container.
- Break indicator - a vertical zigzag line across the bar height signals the axis break.
- Overdrive section - a proportionally scaled continuation beyond the break shows how much the bar exceeds the cut point.
Bars that fit within the available space render normally. Among overflowing bars, the overdrive width is proportional to the overflow amount, so a bar overflowing by 200 px gets twice the overdrive of one overflowing by 100 px.
AC scenario bars break at a wider point than PP, FC, and PL bars. This staggered break position maintains the IBCS visual hierarchy between scenario types.
Overdrive bars apply to bar mode only and do not affect stacked charts, relative variance needles, or auto-fit scaling. The existing overflow warning is still emitted alongside the visual treatment.
Example: 100% stacked bars
Section titled “Example: 100% stacked bars”Show the relative contribution of each scenario as a percentage:
Inherited props
Section titled “Inherited props”Instead of repeating scenarios, variances, order, and orderDirection on every component, you can inherit them from an ancestor LayoutPage or LayoutCard. Set any of these fields to a special keyword:
| Value | Resolves from |
|---|---|
inherited-closest |
Nearest ancestor LayoutCard or LayoutPage that sets the field |
inherited-page |
Nearest ancestor LayoutPage only (skips cards) |
The inherited value is read from the ancestor’s corresponding titleScenarios, titleVariances, titleOrder, or titleOrderDirection field. With inherited-closest, a LayoutCard that does not set the field is skipped and the lookup continues outwards to the LayoutPage. Template engines before v1.0.0-next.28 ask only the nearest card or page.
A keyword cannot be resolved when the page (and, for inherited-closest, every enclosing card) does not set the matching field. From template engine v1.0.0-next.28 on, the component then behaves as if the field were not set (scenarios are auto-detected, the default order is used) and shows a warning. Older engines keep the keyword as a literal value: nothing is auto-detected and the component renders without usable scenarios or order. bino lint reports this case with the rule inherited-prop-unresolved.
Example: inherit everything from the page
Section titled “Example: inherit everything from the page”Example: inherit from the closest card
Section titled “Example: inherit from the closest card”Attribute Reference
Section titled “Attribute Reference”Common Metadata
Section titled “Common Metadata”| Attribute | Type | Required | Default | Description |
|---|---|---|---|---|
apiVersion |
string | yes | - | Must be bino.bi/v1alpha1. |
kind |
string | yes | - | Must be ChartStructure. |
metadata.name |
string | yes | - | Unique identifier. |
metadata.labels |
object | no | - | Key-value pairs for categorization and constraint matching. |
metadata.annotations |
object | no | - | Arbitrary key-value metadata, not used by the system. |
metadata.description |
string | no | - | Free-form description. |
metadata.constraints |
array | no | - | Conditional inclusion rules. See Constraints. |
Spec Attributes
Section titled “Spec Attributes”| Attribute | Type | Required | Default | Description | Sample |
|---|---|---|---|---|---|
spec.dataset |
string, object, or array | yes | - | Dataset reference: a name, an inline DataSet definition, or an array of those (at least one). Provided by the withDataset mixin in the template engine. |
dataset: revenue_by_region |
spec.chartTitle |
string | no | "" |
Custom chart title. | chartTitle: "Revenue by region" |
spec.filter |
string | no | "" |
AlaSQL WHERE clause fragment to filter rows. | filter: "region_group = 'EMEA'" |
spec.level |
string | no | auto-detect with warning | Aggregation level. Values: rowgroup, rowgroupindex, category, categoryindex, subcategory, subcategoryindex, auto. The index variants keep the original dataset order. When auto, detected silently. When omitted, detected with a warning. |
level: category |
spec.order |
string | no | auto-detect with warning | Sort key. Values: auto, category, categoryindex, rowgroup, rowgroupindex, ac1-ac4, fc1-fc4, pp1-pp4, pl1-pl4, inherited-closest, inherited-page. When auto, detected silently. When omitted, detected with a warning. A scenario used here must also appear in scenarios. |
order: ac1 |
spec.orderDirection |
string | no | asc |
Sort direction. Values: asc, desc, inherited-closest, inherited-page. |
orderDirection: desc |
spec.measureScale |
string | no | - | SI prefix for measure scaling; the original values are converted. _ means no prefix, GREATEST picks the largest and LEAST the smallest value in the dataset. Values: _, k, M, G, T, P, E, Z, Y, m, μ, n, p, f, a, z, y, GREATEST, LEAST (case-sensitive). |
measureScale: M |
spec.measureUnit |
string | no | "" |
Unit string for the chart axis. | measureUnit: "EUR" |
spec.unitScaling |
string or number | no | auto-fit with warning | Name of a scaling group, auto, or data units per em of bar width (larger value = smaller bars). Numeric values enable overdrive bars on overflow. |
unitScaling: 250000 |
spec.percentageScaling |
string or number | no | auto-fit with warning | Name of a scaling group, auto, or percentage points per em of bar length. |
percentageScaling: 10 |
spec.pixelPerUnit |
number | no | - | Explicit pixels-per-unit override (minimum 0). | pixelPerUnit: 0.1 |
spec.showCategories |
boolean | no | true |
Show category labels on bars. | showCategories: true |
spec.showMeasureScale |
boolean | no | false |
Show measure unit in chart header. | showMeasureScale: true |
spec.limit |
integer | no | 0 |
Maximum bars per group. Extra rows are cumulated as REST. 0 means unlimited. |
limit: 10 |
spec.scenarios |
string or array | no | auto-detect with warning | Scenario measures (up to 4), as a YAML array or a JSON/CSV string. Values: ac1-ac4, fc1-fc4, pp1-pp4, pl1-pl4. The string form also accepts inherited-closest or inherited-page. |
scenarios: ["ac1", "pp1"] |
spec.variances |
string or array | no | - | Variance definitions calculated from the given scenarios. Pattern: d<scenarioB>_<scenarioA>_[pos|neg|neu], with dr… for the relative variance. The string form also accepts inherited-closest or inherited-page. |
variances: ["dac1_pp1_pos"] |
spec.scale |
string or number | no | auto-scale with warning | Proportional scaling. Omitted: auto-scale to fit parent height with warning. "none": no scaling. "auto": auto-scale silently. Positive number, as a number or a numeric string: fixed factor. An empty string is rejected. |
scale: auto |
spec.i18nNamespace |
string | no | - | I18n namespace for this component’s labels; missing keys fall back to _system. Resolved at runtime from the nearest ancestor carrying one (card, page, tree, grid, or the artefact) when not set. Maps to the i18n-namespace HTML attribute. |
i18nNamespace: audited |
spec.stack |
object | no | - | Stacked bar rendering configuration. When set, bars are stacked instead of shown side-by-side. See Stack configuration. | see below |
spec.stack.by |
string | yes (inside stack) |
- | Stacking dimension. scenarios: stacks scenario slots end-to-end. dimensions: auto-derives the stack column from level (rowGroup→category, category→subCategory). |
by: scenarios |
spec.stack.mode |
string | no | absolute |
Stacking mode. Values: absolute (additive), relative (100% stacked), absolute-relative (absolute height with percentage labels). |
mode: relative |
spec.stack.order |
string | no | dataset |
Segment order within each stack. Values: asc, desc, dataset. |
order: dataset |
spec.selectedStyle |
string | no | - | Name of a ComponentStyle manifest to apply. Merged over the _system and _default styles. Maps to the selected-style HTML attribute. |
selectedStyle: corporate-style |
spec.ruleset |
string | no | - | Name of a RuleSet manifest to apply, or inherited-closest / inherited-page to inherit the surrounding layout’s rule set. Merged over the _system and _default rule sets. Maps to the ruleset HTML attribute. |
ruleset: corporate-rules |
Stack configuration
Section titled “Stack configuration”| Property | Type | Required | Default | Description |
|---|---|---|---|---|
stack.by |
string | yes | - | Stacking dimension. scenarios: stacks scenario slots end-to-end. dimensions: auto-derives from level prop. |
stack.mode |
string | no | absolute |
Stacking mode. absolute: additive. relative: 100% stacked. absolute-relative: absolute height with percentage labels. |
stack.order |
string | no | dataset |
Segment order within each stack. Values: asc, desc, dataset. |