ChartTime
ChartTime manifests describe time-based charts.
They share many fields with ChartStructure but add date-axis-specific options.
Minimal definition
Section titled “Minimal definition”The smallest well-formed ChartTime sets the required spec.dataset plus the fields
that give the chart a message: a title, the axis granularity, and the scenario columns
with their scale and unit. Scenarios are detected from the dataset when left blank, but
the detection emits a warning, so pinning them keeps the chart stable when the data
changes.
All attributes are listed in the Attribute Reference below.
The same chart renders as a line instead of columns with chartMode: line, and as
stacked columns or a stacked area with the stack block (see
Stack configuration).
Fields
Section titled “Fields”dataset- required; a dataset name, an inlineDataSetdefinition, or an array of those.chartTitle- optional title.chartMode- rendering mode:bar(default),line, orauto. When set toauto, the chart automatically switches to line mode when data points exceedmaxBars.maxBars- threshold for auto-switching to line mode (default: 28). Only applies whenchartModeisauto.lineFullWidth- whentrue(default in the renderer), line charts stretch to fill the full parent width instead of using fixed per-data-point spacing. Has no effect in bar mode.axisLabelsMode- how the date labels along the time axis are written.smart(default) prints only the part that changed since the previous label, so the year appears only where a new year starts;longandshortuse the long or the short date style for every label.dateInterval- desired time granularity;autolets the renderer choose based on dataset meta.filter- optional filter expression.measureScale,measureUnit- SI prefix and unit string.showCategories,showMeasureScale- visibility flags.showOverlayAvg,showOverlayMedian- enables overlay lines.intervalSpanLimit- controls how many columns drive automatic date interval selection.unitScaling- data units displayed per 1 em of bar height (map-scale semantics: larger value = smaller bars),autoto fit the available height, or the name of a ScalingGroup. Unset or invalid values auto-fit with a warning that reports the resolved value.percentageScaling- percentage points per 1 em of pin/bar length for relative variances (10→ a +10 % pin is 1 em long); sameauto/group-name options.syncSpaceLeft- space reserved left of the axis for the scenario labels and the chart title, in px.-1(default) measures the widest label. Set the same value on several charts to align their axes; a value smaller than the widest label clips it.scenarios- list of scenarios (up to 4); values likeac1-ac4,fc1-fc4,pp1-pp4,pl1-pl4, orauto. When set toauto, scenarios are detected from the dataset silently. When left blank, they are detected with a warning.variances- list of variance definitions of the formd<scenarioB>_<scenarioA>_[pos|neg|neu].scale- proportional scaling of the chart (font size, spacings, and bar/column dimensions all scale together). Scaling triggers on width overflow (horizontal axis labels cut off).- not set - auto-scale to fit the parent width; emits an
AUTO_scalewarning with the applied factor. An empty string is not a valid value; omit the key instead. "none"- no scaling; render at the base font size regardless of available space."auto"- auto-scale to fit the parent width silently (no warning)."0.5","1.2", … - fixed factor applied to the base font size. All dimensions scale proportionally.
- not set - auto-scale to fit the parent width; emits an
stack- optional object to enable stacked rendering:by- (required) stacking dimension:scenariosstacks scenario slots end-to-end;dimensionsdraws only the first scenario, one segment per period; additional scenarios are discarded with a warning.mode- stacking mode:absolute(additive, default),relative(100% stacked), orabsolute-relative(absolute height with percentage labels).order- segment order within each stack:asc,desc, ordataset(default).- When
chartModeisbar, produces stacked columns. WhenchartModeisline, produces a stacked area chart.
i18nNamespace- optional namespace consulted for this component’s labels; missing keys fall back to_system. When not set, it is resolved from the nearest ancestor carrying one.selectedStyle- optional name of aComponentStyleto apply; merged over the_systemand_defaultstyles.ruleset- optional name of aRuleSetto apply, orinherited-closest/inherited-pageto inherit the surrounding layout’s rule set; merged over the_systemand_defaultrule sets.
level, order, orderDirection and limit are still accepted, but have no effect: a time chart always shows one value per period, in date order. bino does not pass them to the template engine, and bino lint reports them with chart-time-field-no-effect.
Example: Monthly revenue line chart
Section titled “Example: Monthly revenue line chart”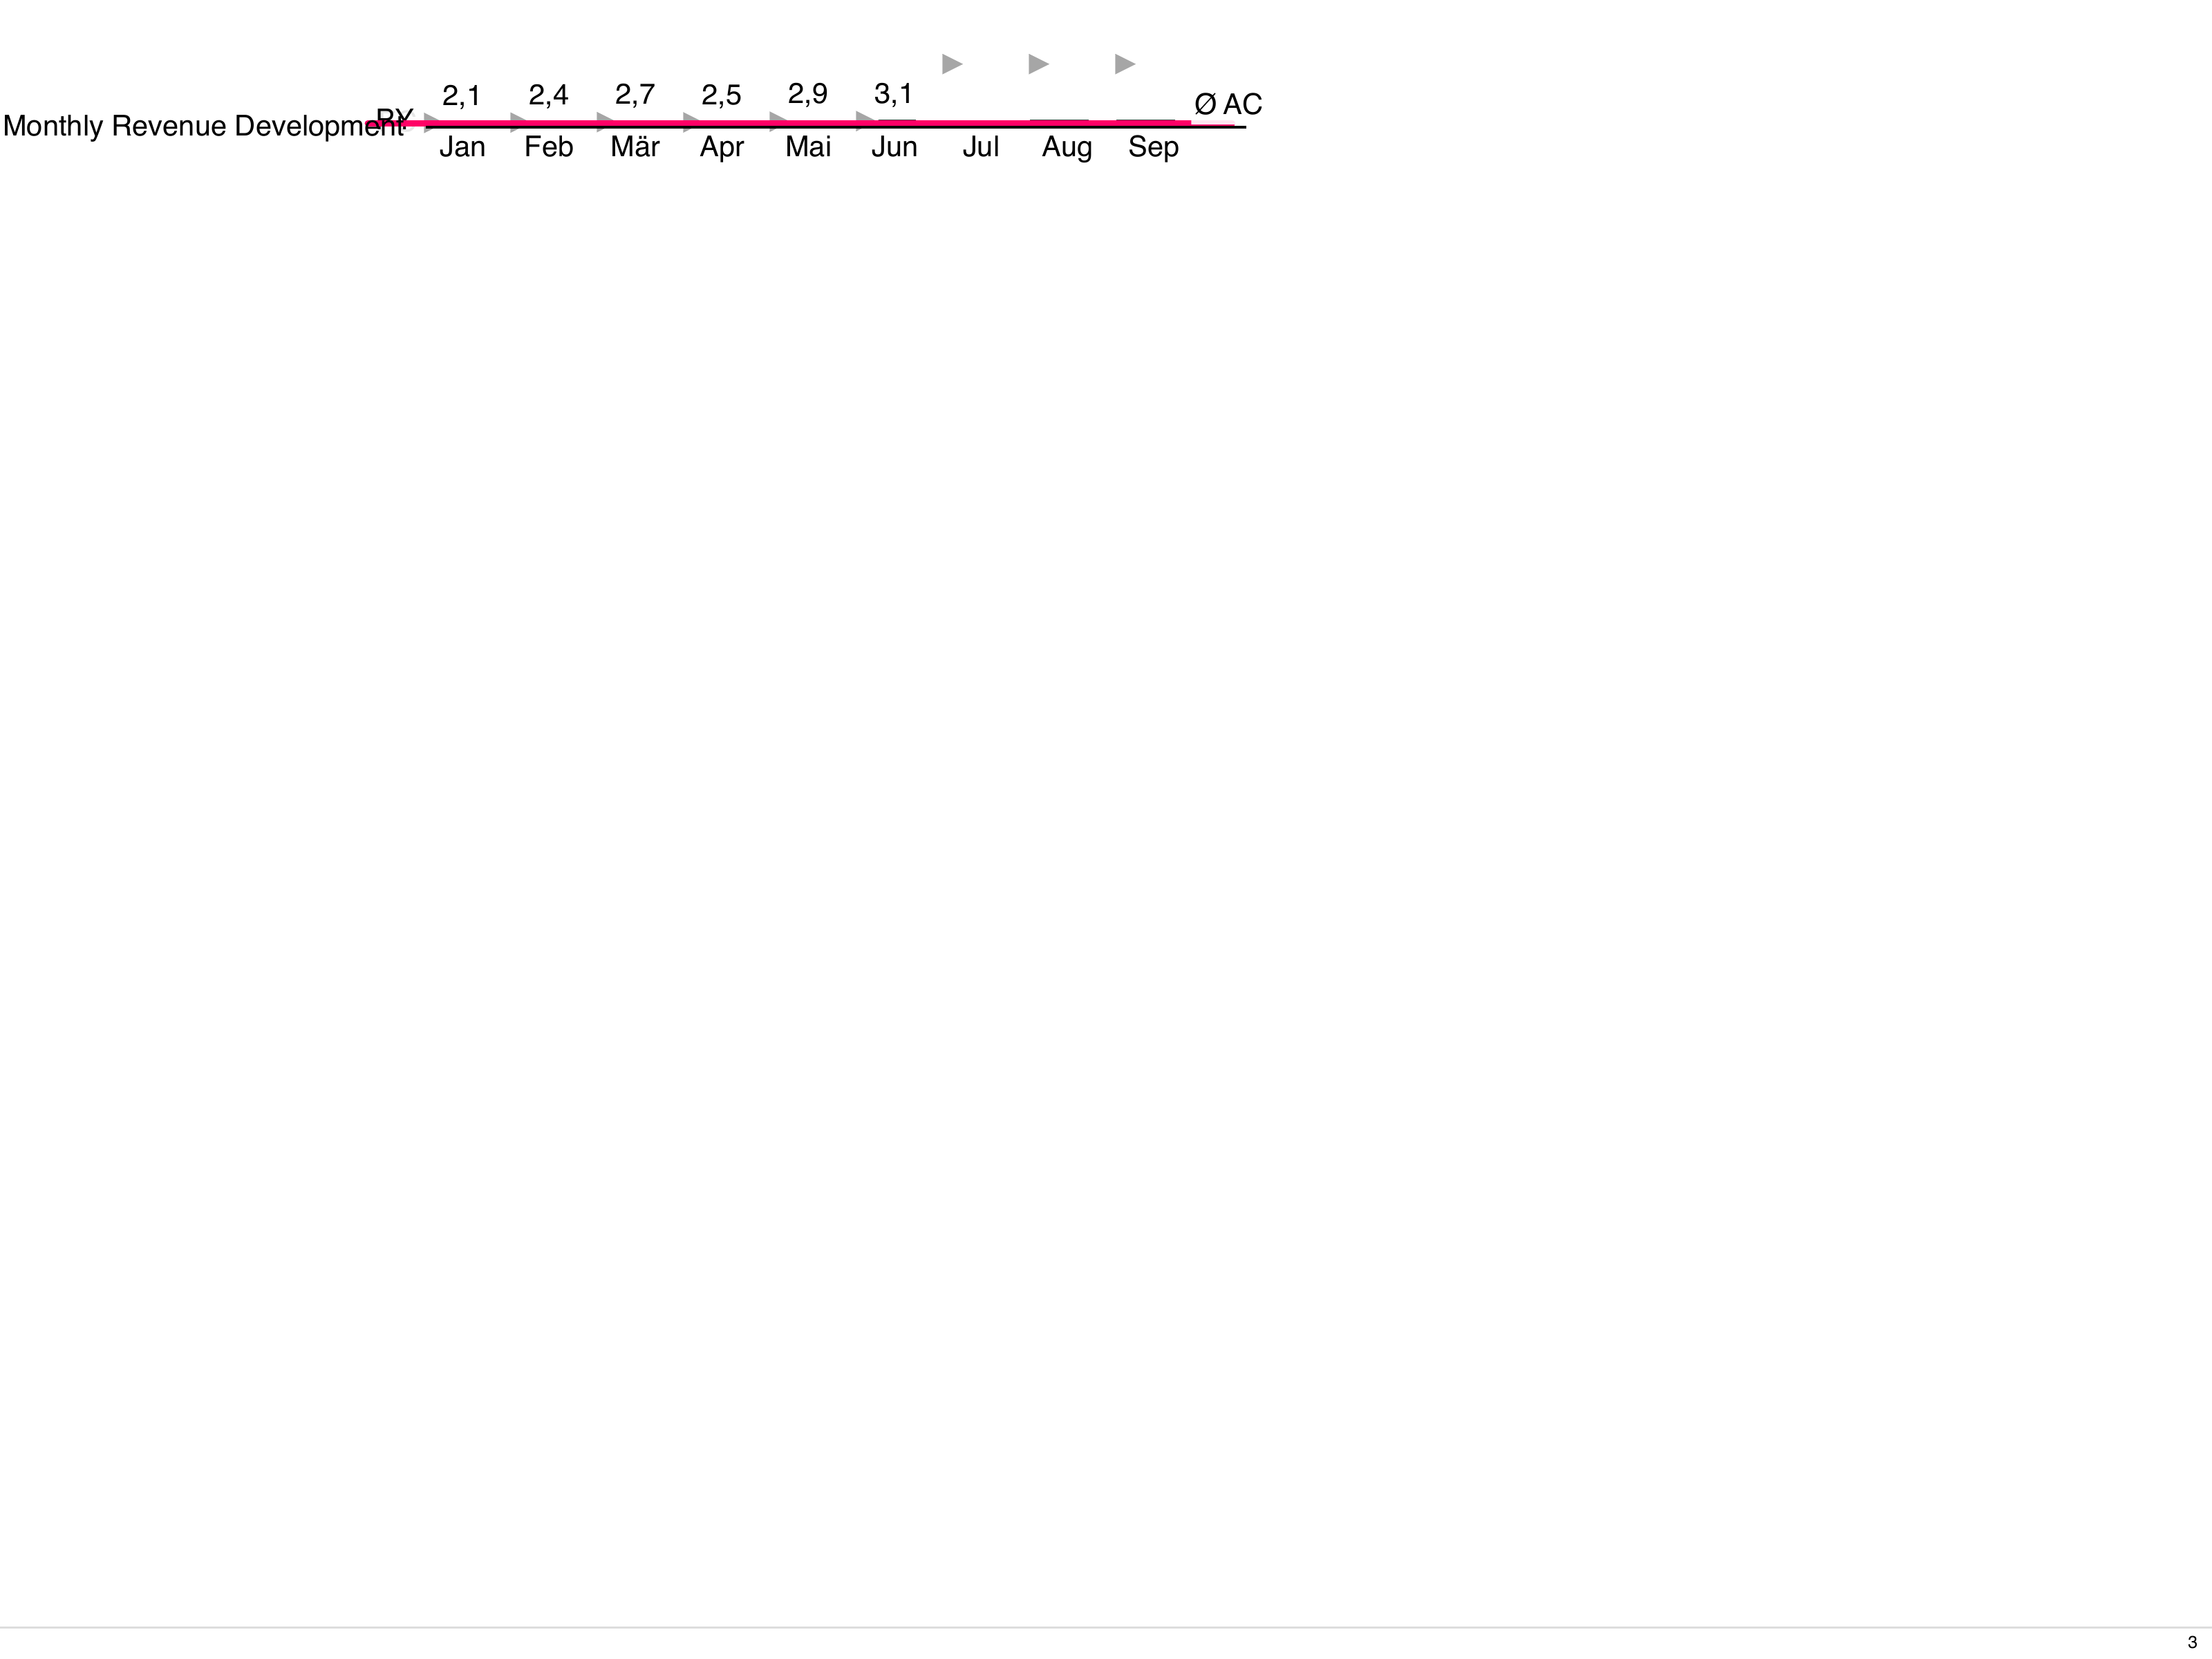
Example: Short axis date labels
Section titled “Example: Short axis date labels”Write every axis label in the short date style instead of the default smart mode:
With dateInterval: month the axis reads Jan, Feb, Mar, … on every column and never
shows the year. The default smart writes the same labels but adds the year where a new one
starts (Jan 26), and long writes Jan 2026 on every column, which needs much more width.
Example: Line chart mode
Section titled “Example: Line chart mode”Force line chart rendering with square markers at each data point:
Example: Auto-switching mode
Section titled “Example: Auto-switching mode”Automatically switch to line chart when data points exceed the threshold:
Line chart features
Section titled “Line chart features”When rendered in line mode:
- Square markers (8×8px) at each data point
- Data values displayed above each marker
- Scenario labels positioned to the right of the last data point
- Smart X-axis labels showing start, end, and year boundaries
- Vertical dashed separator lines at year transitions
- IBCS color schema:
- AC (Actual): Black fill, black stroke, solid line
- PP (Previous Period): Gray fill, gray stroke, solid line
- FC (Forecast): White fill, black stroke, dashed line
- PL (Plan): White fill, black stroke, solid line
Overdrive bars (overflow handling)
Section titled “Overdrive bars (overflow handling)”When unitScaling is set to a fixed numeric value (not auto), bars may exceed the
available container height. Instead of silently clipping the bars, the renderer applies
overdrive rendering:
- Base section - the bar is drawn up to a computed cut height that fits within the container.
- Break indicator - a zigzag line across the bar width signals the axis break.
- Overdrive section - a proportionally scaled continuation above the break shows how much the bar exceeds the cut point.
Bars that fit within the available space render normally. Among overflowing bars, the overdrive height is proportional to the overflow amount, so a bar overflowing by 200 px gets twice the overdrive of one overflowing by 100 px.
AC scenario bars break at a higher point than PP, FC, and PL bars. This staggered break position maintains the IBCS visual hierarchy between scenario types.
Overdrive bars apply to bar mode only and do not affect line charts, stacked charts, or auto-fit scaling. The existing overflow warning is still emitted alongside the visual treatment.
Example: Stacked columns by scenario
Section titled “Example: Stacked columns by scenario”Stack AC and PP values as additive columns:
Example: 100% stacked columns
Section titled “Example: 100% stacked columns”Show the relative contribution of each scenario:
Example: Stacked area chart
Section titled “Example: Stacked area chart”Combine chartMode: line with stack to render stacked area fills:
Inherited props
Section titled “Inherited props”Instead of repeating scenarios and variances on every component, you can inherit them from an ancestor LayoutPage or LayoutCard. Set either of them to a special keyword:
| Value | Resolves from |
|---|---|
inherited-closest |
Nearest ancestor LayoutCard or LayoutPage that sets the field |
inherited-page |
Nearest ancestor LayoutPage only (skips cards) |
The inherited value is read from the ancestor’s corresponding titleScenarios or titleVariances field. With inherited-closest, a LayoutCard that does not set the field is skipped and the lookup continues outwards to the LayoutPage. Template engines before v1.0.0-next.28 ask only the nearest card or page.
A keyword cannot be resolved when the page (and, for inherited-closest, every enclosing card) does not set the matching field. From template engine v1.0.0-next.28 on, the component then behaves as if the field were not set (scenarios are auto-detected) and shows a warning. Older engines keep the keyword as a literal value: nothing is auto-detected and the component renders without usable scenarios. bino lint reports this case with the rule inherited-prop-unresolved.
See the ChartStructure inherited props section for full examples.
Attribute Reference
Section titled “Attribute Reference”Common Metadata
Section titled “Common Metadata”| Attribute | Type | Required | Default | Description |
|---|---|---|---|---|
apiVersion |
string | yes | - | Must be bino.bi/v1alpha1. |
kind |
string | yes | - | Must be ChartTime. |
metadata.name |
string | yes | - | Unique identifier. |
metadata.labels |
object | no | - | Key-value pairs for categorization and constraint matching. |
metadata.annotations |
object | no | - | Arbitrary key-value metadata, not used by the system. |
metadata.description |
string | no | - | Free-form description. |
metadata.constraints |
array | no | - | Conditional inclusion rules. See Constraints. |
Spec Attributes
Section titled “Spec Attributes”| Attribute | Type | Required | Default | Description | Sample |
|---|---|---|---|---|---|
spec.dataset |
string, object, or array | yes | - | Dataset reference: a name, an inline DataSet definition, or an array of those. Provided by the withDataset mixin in the template engine. |
dataset: revenue_daily |
spec.chartTitle |
string | no | "" |
Custom chart title. | chartTitle: "Daily revenue" |
spec.chartMode |
string | no | bar |
Rendering mode. Values: bar, line, auto. When auto, switches to line when data points exceed maxBars. |
chartMode: line |
spec.maxBars |
integer | no | 28 |
Threshold for auto-switching to line mode. Only applies when chartMode is auto. Minimum: 1. |
maxBars: 15 |
spec.lineFullWidth |
boolean | no | true |
Stretch line charts to fill full parent width. Has no effect in bar mode. | lineFullWidth: true |
spec.axisLabelsMode |
string | no | smart |
Format of the date labels along the time axis. smart prints only the part that changed since the previous label (the year only at a year boundary); long and short use the long or the short date style for every label. Values: smart, long, short. |
axisLabelsMode: short |
spec.dateInterval |
string | no | auto-detect | Time granularity. Values: year, quarter, month, week, day, hour, minute, second, millisecond, auto. |
dateInterval: month |
spec.filter |
string | no | "" |
AlaSQL WHERE clause fragment to filter rows. | filter: "region_group = 'EMEA'" |
spec.measureScale |
string | no | largest value in the dataset | SI prefix for measure scaling; _ means no prefix, GREATEST uses the largest and LEAST the smallest value in the dataset. Values (case-sensitive): _, k, M, G, T, P, E, Z, Y, m, μ, n, p, f, a, z, y, GREATEST, LEAST. |
measureScale: M |
spec.measureUnit |
string | no | "" |
Unit string for the chart axis. | measureUnit: "EUR" |
spec.unitScaling |
string or number | no | auto-fit with warning | Name of a scaling group, auto, or data units per em of bar height (larger value = smaller bars). Numeric values enable overdrive bars on overflow. |
unitScaling: 250000 |
spec.percentageScaling |
string or number | no | auto-fit with warning | Name of a scaling group, auto, or percentage points per em of pin length. |
percentageScaling: 10 |
spec.syncSpaceLeft |
number | no | -1 |
Space reserved left of the axis for the scenario labels and the chart title, in pixels. -1 measures the widest label. Set the same value on several charts to align their axes; a value smaller than the widest label clips it. |
syncSpaceLeft: 80 |
spec.showCategories |
boolean | no | true |
Show category labels. | showCategories: false |
spec.showMeasureScale |
boolean | no | false |
Show measure unit in chart header. | showMeasureScale: true |
spec.showOverlayAvg |
boolean | no | true |
Show average overlay line. | showOverlayAvg: true |
spec.showOverlayMedian |
boolean | no | false |
Show median overlay line. | showOverlayMedian: true |
spec.intervalSpanLimit |
integer | no | 28 |
Maximum number of columns used to calculate the axis date interval; only applies when dateInterval is auto or unset. Minimum: 0. |
intervalSpanLimit: 50 |
spec.scenarios |
string or array | no | - | Scenario measures (up to 4). Values: ac1-ac4, fc1-fc4, pp1-pp4, pl1-pl4, auto, inherited-closest, inherited-page. |
scenarios: ["ac1", "fc1"] |
spec.variances |
string or array | no | - | Variance definitions. Pattern: d<scenarioB>_<scenarioA>_[pos|neg|neu]. Also accepts inherited-closest or inherited-page. |
variances: ["dfc1_ac1_pos"] |
spec.scale |
string or number | no | auto-scale with warning | Proportional scaling; font size, spacings, and bar dimensions scale together. Omitted: auto-scale to fit parent width with warning. "none": no scaling. "auto": auto-scale silently. Positive number: fixed factor (0.5, 1.2, …). An empty string is rejected. |
scale: auto |
spec.i18nNamespace |
string | no | - | I18n namespace for this component’s labels; missing keys fall back to _system. Resolved at runtime from the nearest ancestor carrying one (card, page, tree, grid, or the artefact) when not set. Maps to the i18n-namespace HTML attribute. |
i18nNamespace: audited |
spec.stack |
object | no | - | Stacked rendering configuration. When chartMode is bar, produces stacked columns. When chartMode is line, produces stacked area chart. See Stack configuration. |
see below |
spec.stack.by |
string | yes (within stack) |
- | Stacking dimension. Values: scenarios (stacks scenario slots end-to-end), dimensions (draws only the first scenario, one segment per period). |
by: scenarios |
spec.stack.mode |
string | no | absolute |
Stacking mode. Values: absolute (additive), relative (100% stacked), absolute-relative (absolute height with percentage labels). |
mode: relative |
spec.stack.order |
string | no | dataset |
Segment order within each stack. Values: asc, desc, dataset. |
order: desc |
spec.selectedStyle |
string | no | - | Name of a ComponentStyle manifest to apply. Merged over the _system and _default styles. Maps to the selected-style HTML attribute. |
selectedStyle: corporate-style |
spec.ruleset |
string | no | - | Name of a RuleSet manifest to apply, or inherited-closest / inherited-page to inherit the surrounding layout’s rule set. Merged over the _system and _default rule sets. Maps to the ruleset HTML attribute. |
ruleset: corporate-rules |
Stack configuration
Section titled “Stack configuration”| Property | Type | Required | Default | Description |
|---|---|---|---|---|
stack.by |
string | yes | - | Stacking dimension. scenarios: stacks scenario slots end-to-end. dimensions: only the first scenario is drawn. |
stack.mode |
string | no | absolute |
Stacking mode. absolute: additive. relative: 100% stacked. absolute-relative: absolute height with percentage labels. |
stack.order |
string | no | dataset |
Segment order within each stack. Values: asc, desc, dataset. |