Recipe: Monthly client report
This recipe builds a monthly usage report for SaaS clients. Each client gets a branded PDF with their logo, a KPI summary, a usage trend chart, a feature adoption breakdown, and a data table. The data comes from Postgres.
Project structure
Section titled “Project structure”acme-client-reports/
bino.toml
manifests/
connection.yaml # ConnectionSecret + DataSource
datasets.yaml # DataSet queries
pages.yaml # LayoutPage definitions
report.yaml # ReportArtefact
styles.yaml # ComponentStyle per client
assets/
logo-acme.png
logo-globex.png
scripts/
upload.shConnection and data source
Section titled “Connection and data source”# manifests/connection.yaml
---
apiVersion: bino.bi/v1alpha1
kind: ConnectionSecret
metadata:
name: analyticsDb
spec:
type: postgres
postgres:
passwordFromEnv: POSTGRES_PASSWORD
---
apiVersion: bino.bi/v1alpha1
kind: DataSource
metadata:
name: client_usage
spec:
type: postgres_query
connection:
host: ${DB_HOST:analytics.example.com}
port: 5432
database: analytics
schema: public
user: reporting
secret: analyticsDb
query: |
SELECT
client_id,
month,
active_users,
api_calls,
storage_gb,
feature,
feature_sessions
FROM v_client_monthly_usage
WHERE month = DATE_TRUNC('month', CURRENT_DATE - INTERVAL '1 month')Datasets
Section titled “Datasets”# manifests/datasets.yaml
---
apiVersion: bino.bi/v1alpha1
kind: DataSet
metadata:
name: client_kpis
spec:
query: |
SELECT
active_users,
api_calls,
storage_gb,
ROUND(api_calls::DECIMAL / NULLIF(active_users, 0), 1) AS calls_per_user
FROM client_usage
WHERE client_id = '${CLIENT_ID}'
LIMIT 1
---
apiVersion: bino.bi/v1alpha1
kind: DataSet
metadata:
name: usage_trend
spec:
dependencies:
- type: postgres_query
connection:
host: ${DB_HOST:analytics.example.com}
port: 5432
database: analytics
schema: public
user: reporting
secret: analyticsDb
query: |
SELECT month, active_users, api_calls
FROM v_client_monthly_usage
WHERE client_id = '${CLIENT_ID}'
ORDER BY month
query: |
SELECT * FROM @inline(0)
---
apiVersion: bino.bi/v1alpha1
kind: DataSet
metadata:
name: feature_adoption
spec:
query: |
SELECT feature, SUM(feature_sessions) AS sessions
FROM client_usage
WHERE client_id = '${CLIENT_ID}'
GROUP BY feature
ORDER BY sessions DESCLayout pages
Section titled “Layout pages”# manifests/pages.yaml
---
apiVersion: bino.bi/v1alpha1
kind: LayoutPage
metadata:
name: cover
spec:
titleBusinessUnit: "${CLIENT_NAME}"
titleNamespace: _system
pageLayout: full
children:
- kind: Text
spec:
value: "Monthly Usage Report"
style:
fontSize: 36
fontWeight: bold
---
apiVersion: bino.bi/v1alpha1
kind: LayoutPage
metadata:
name: usage-dashboard
spec:
titleBusinessUnit: "${CLIENT_NAME} — Usage Dashboard"
titleNamespace: _system
pageLayout: 2x2
children:
- kind: Text
spec:
dataset: client_kpis
- kind: ChartTime
spec:
dataset: usage_trend
chartTitle: "Monthly active users"
dateInterval: month
level: category
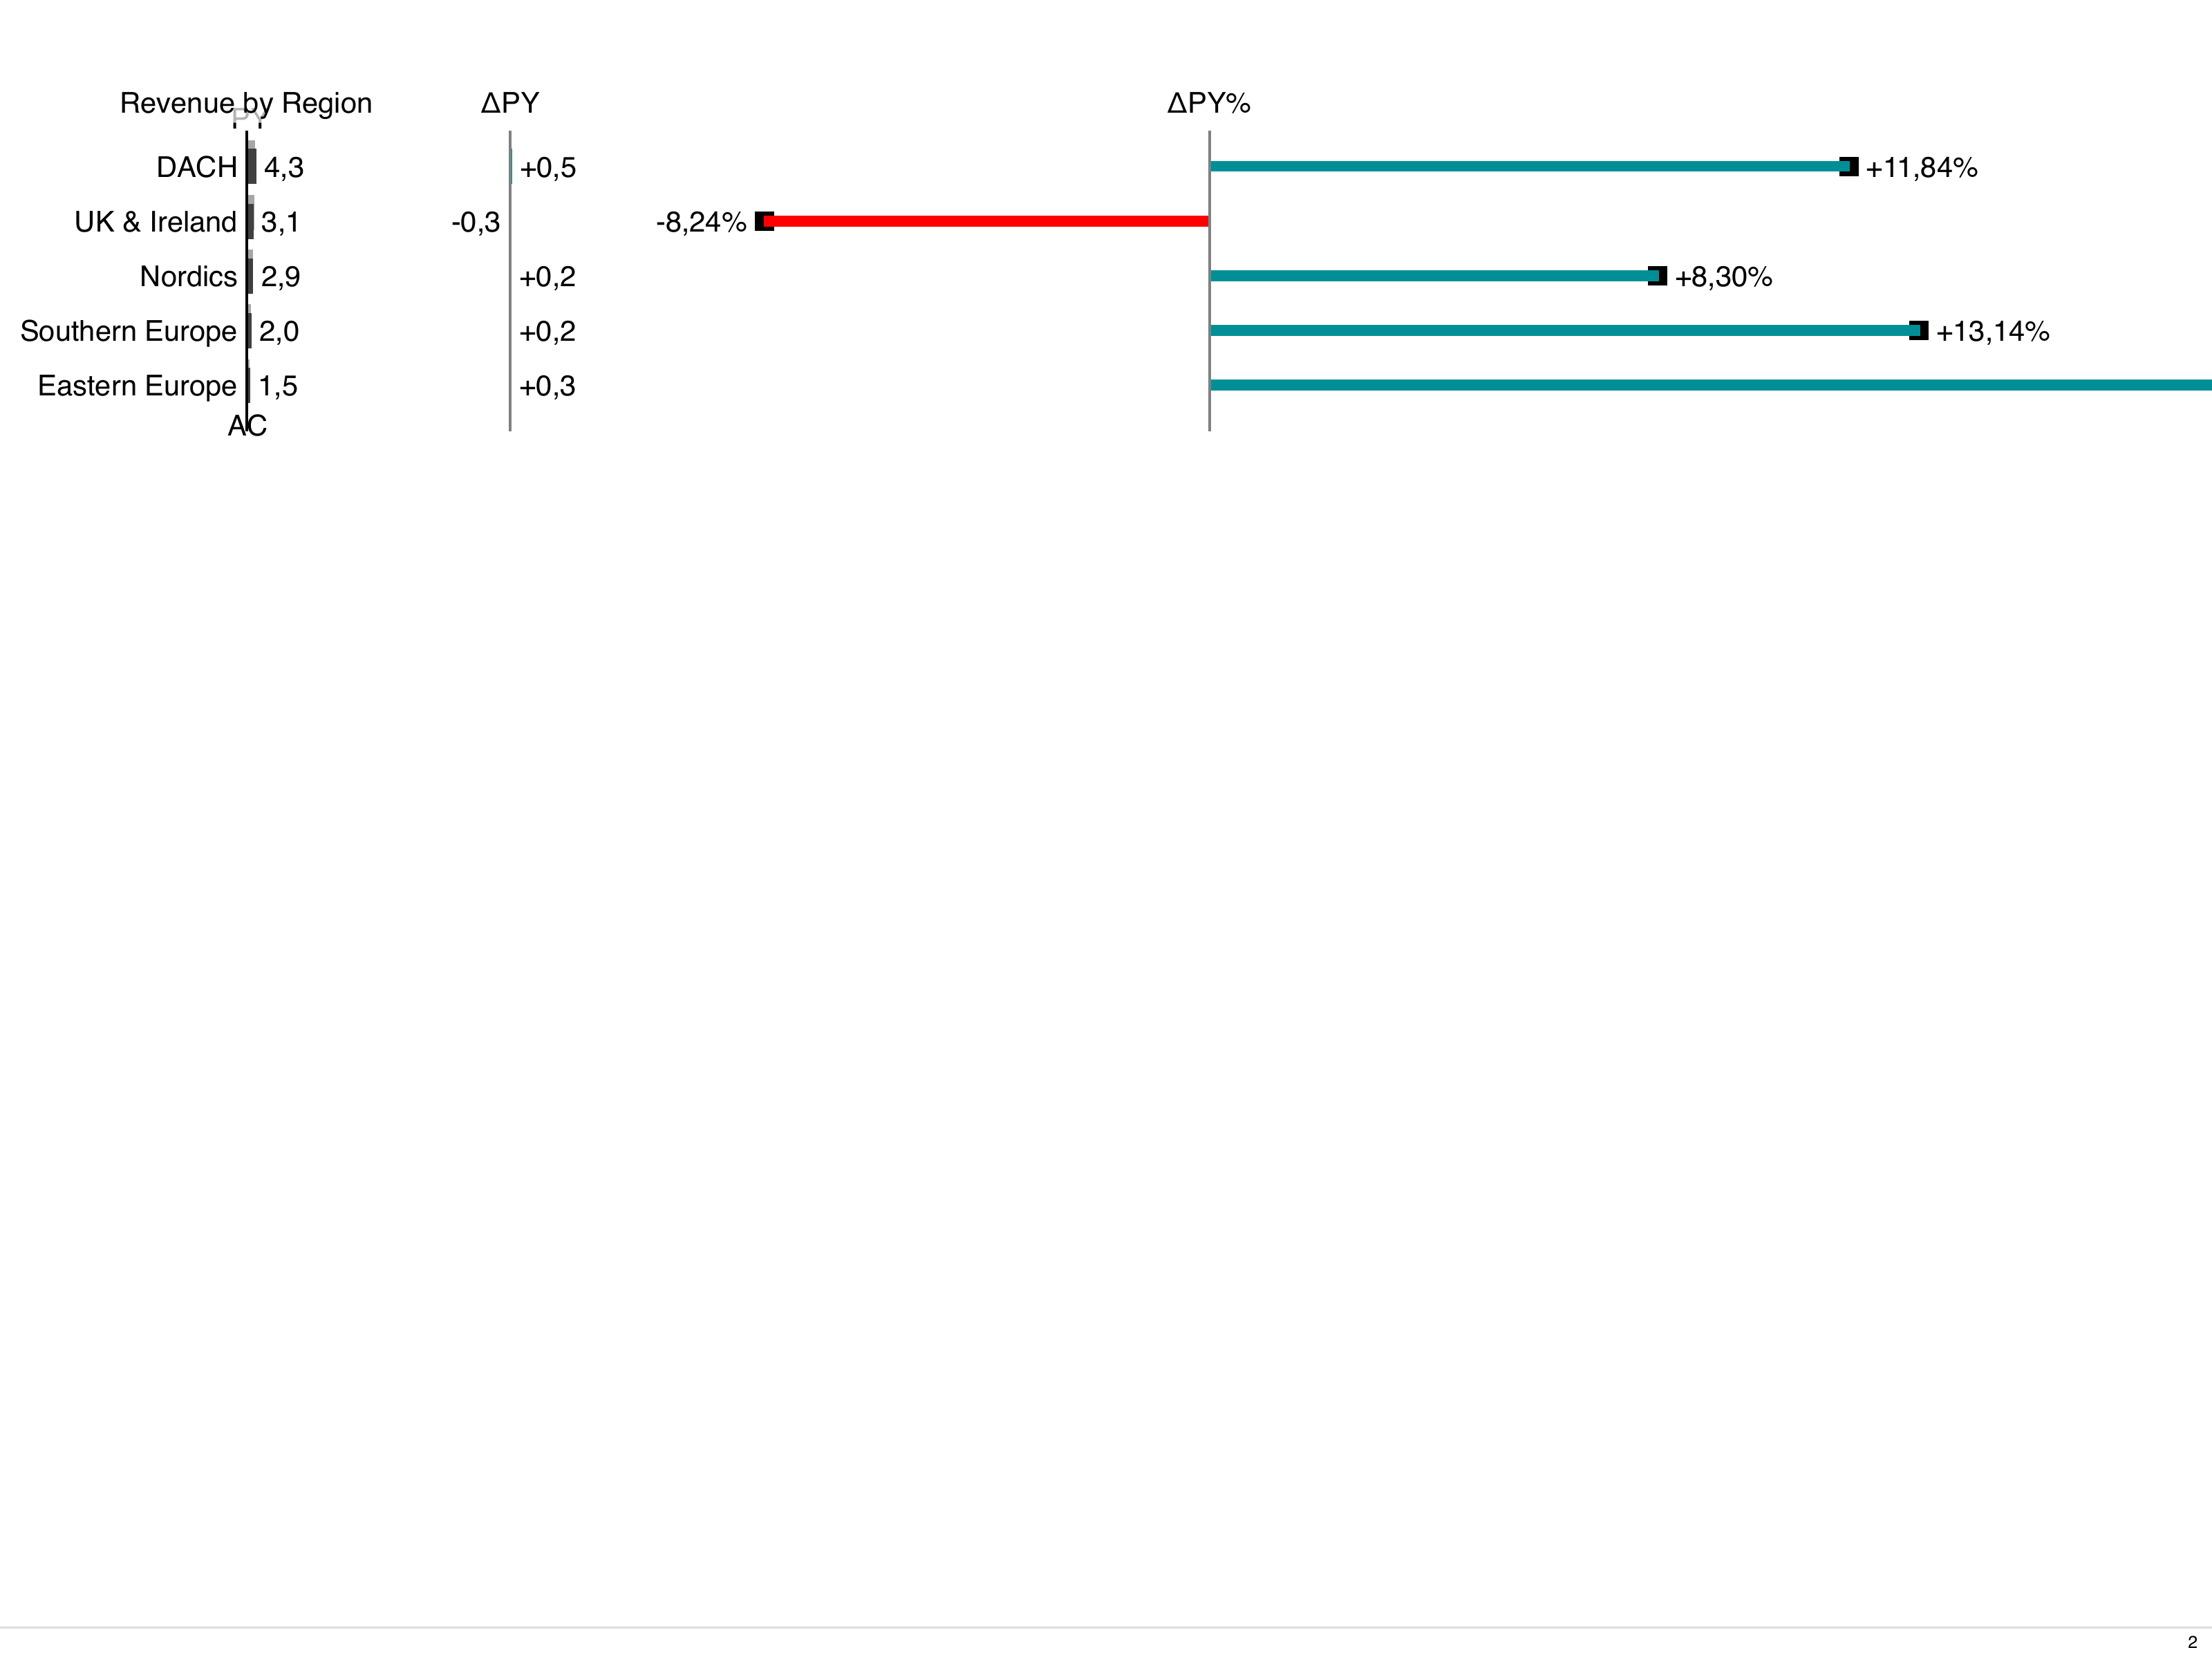
- kind: ChartStructure
spec:
dataset: feature_adoption
chartTitle: "Feature adoption"
level: category
- kind: Table
spec:
dataset: feature_adoption
tableTitle: "Sessions by feature"
type: list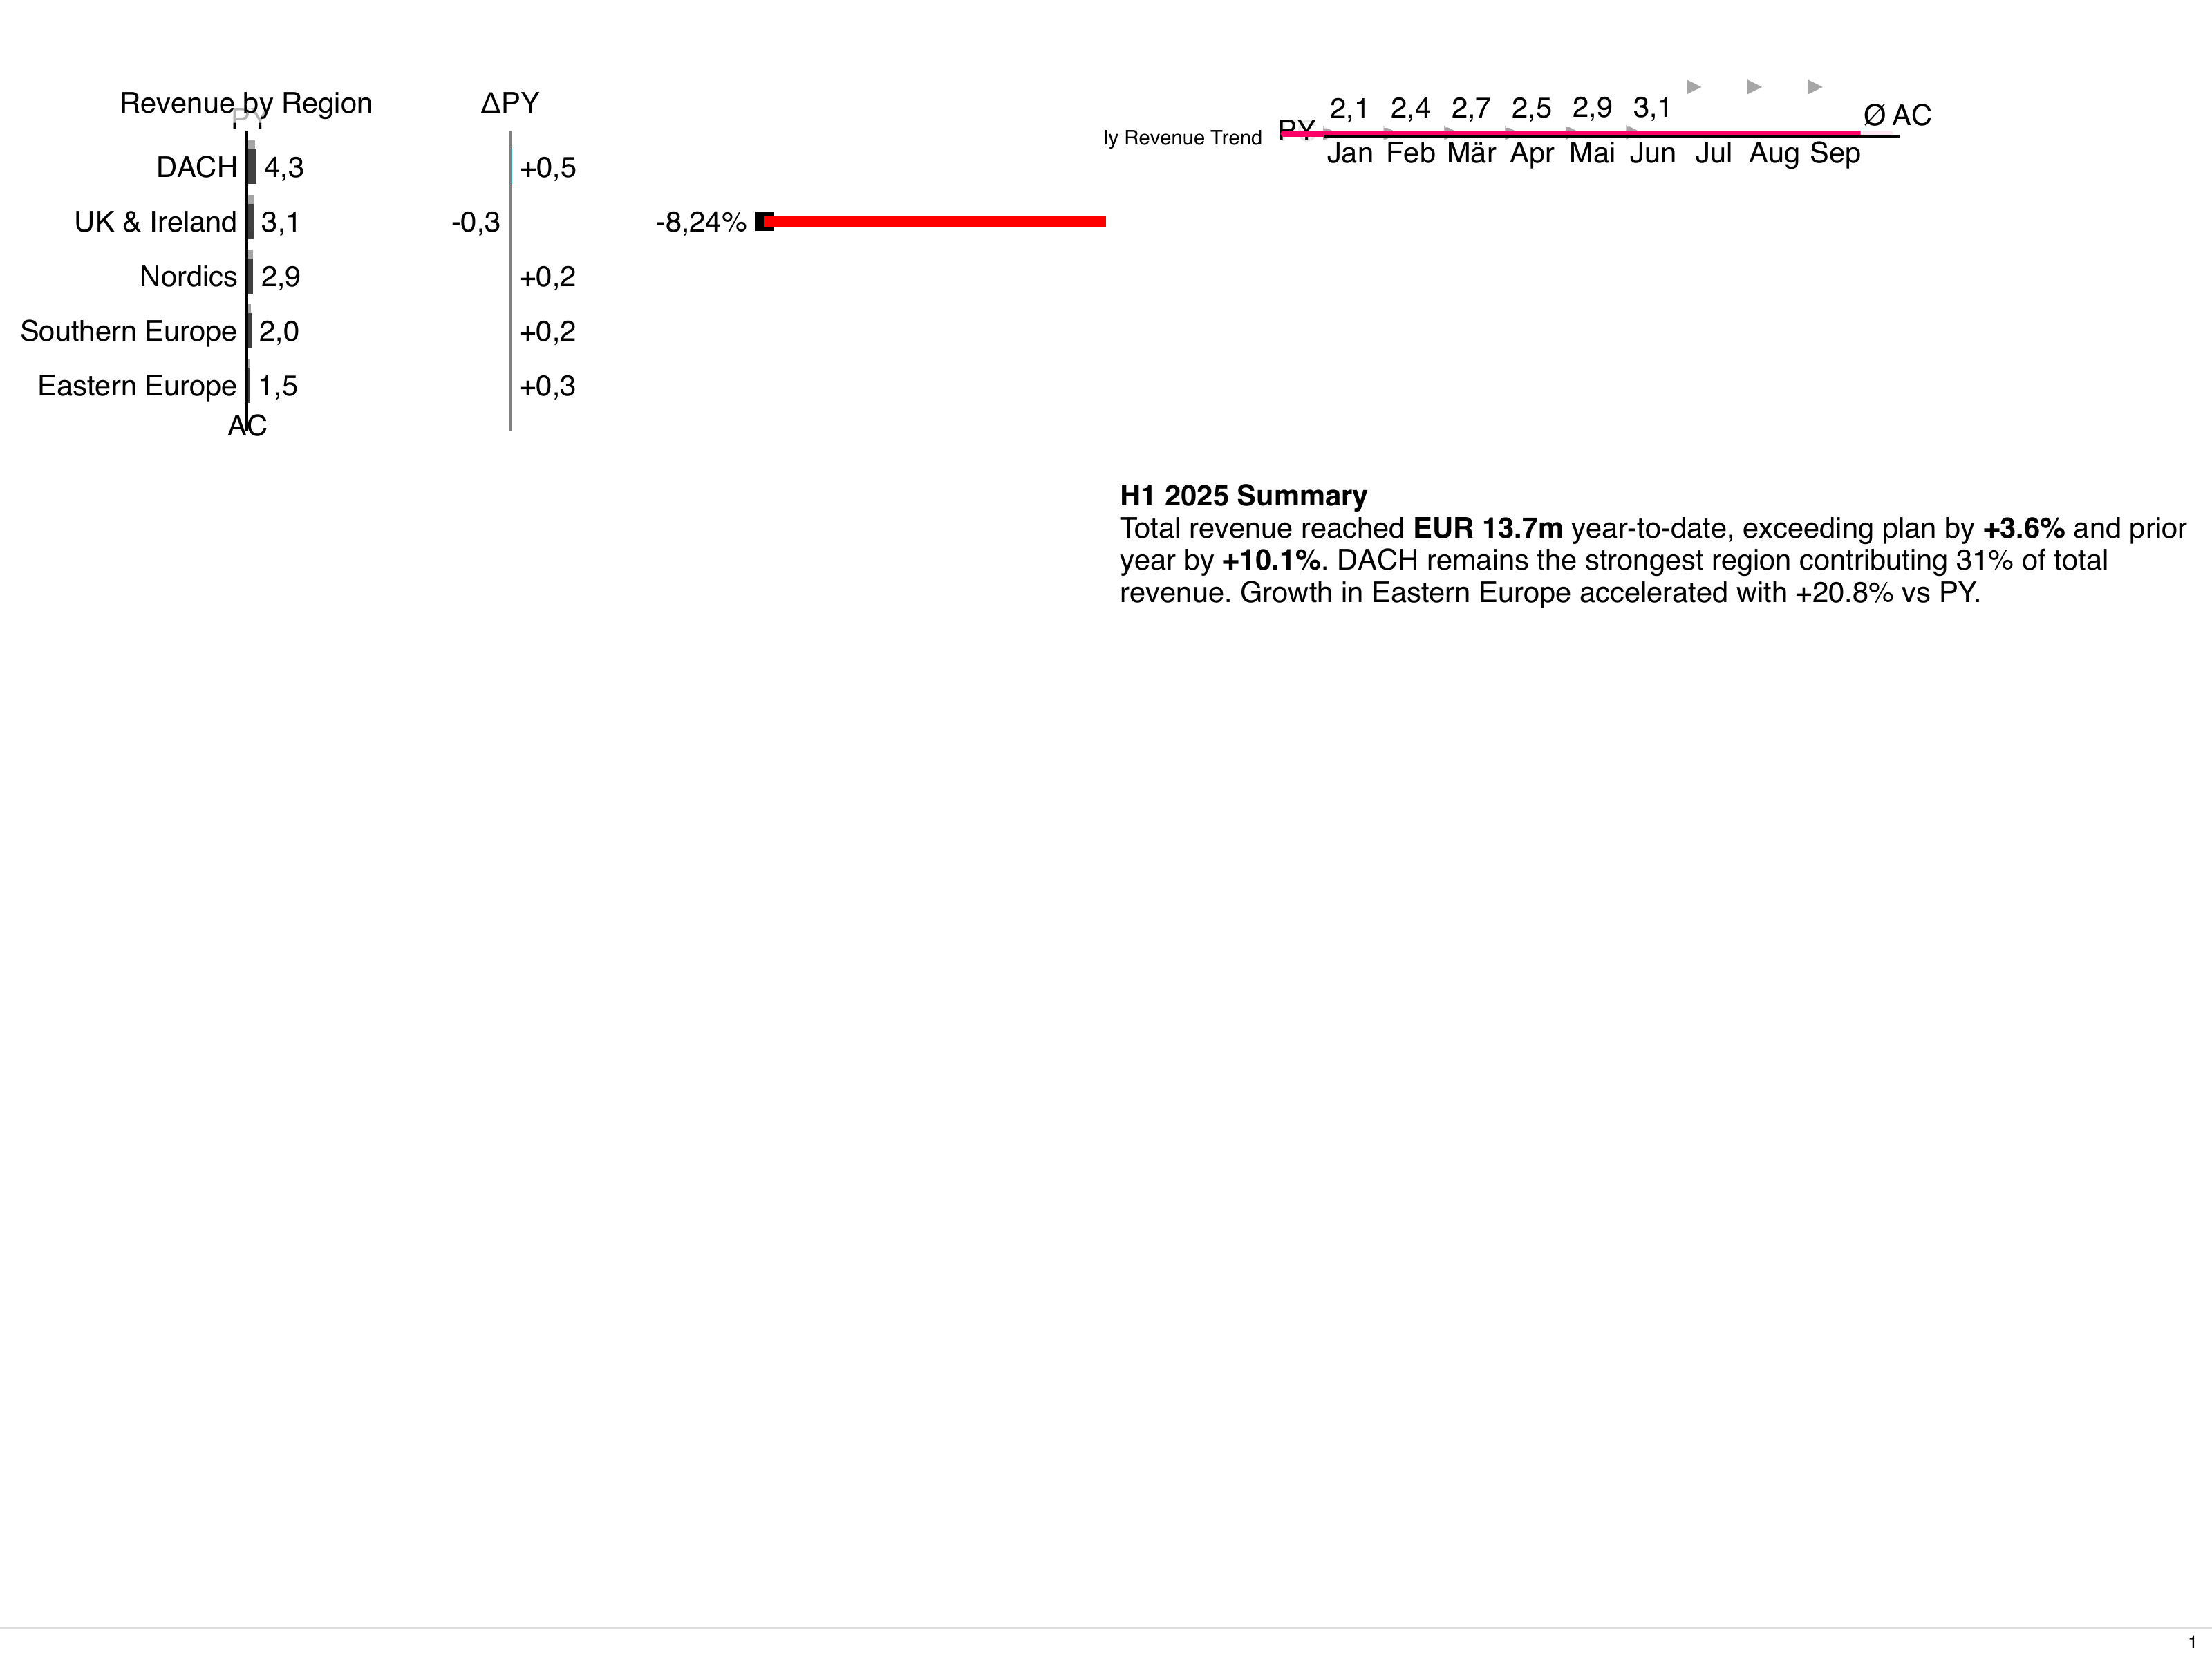
Report artefact
Section titled “Report artefact”# manifests/report.yaml
---
apiVersion: bino.bi/v1alpha1
kind: ReportArtefact
metadata:
name: client_monthly
spec:
format: xga
orientation: landscape
language: en
layoutPages:
- cover
- usage-dashboard
filename: "${CLIENT_ID}-usage-${REPORT_MONTH}.pdf"
title: "${CLIENT_NAME} — Monthly Usage Report"
author: "Acme Analytics"Per-client branding with labels and constraints
Section titled “Per-client branding with labels and constraints”Use labels on the artefact and constraints on styles to apply client-specific branding:
# manifests/styles.yaml
---
apiVersion: bino.bi/v1alpha1
kind: ComponentStyle
metadata:
  name: acme_brand
  constraints:
    - labels.client==acme
spec:
  primaryColor: "#1a73e8"
  fontFamily: "Inter"
---
apiVersion: bino.bi/v1alpha1
kind: ComponentStyle
metadata:
  name: globex_brand
  constraints:
    - labels.client==globex
spec:
  primaryColor: "#e63946"
  fontFamily: "Roboto"
Building for a specific client
Section titled “Building for a specific client”Pass client details as environment variables:
CLIENT_ID=acme CLIENT_NAME="Acme Corp" REPORT_MONTH=2024-11 bino buildOr loop over all clients in a script:
#!/bin/bash
for row in $(cat clients.csv | tail -n +2); do
  IFS=',' read -r id name <<< "$row"
  CLIENT_ID="$id" CLIENT_NAME="$name" REPORT_MONTH="$(date -d '-1 month' +%Y-%m)" \
    bino build --out-dir "dist/$id/"
done
Post-build upload
Section titled “Post-build upload”# bino.toml
[build.hooks]
post-build = ["./scripts/upload.sh"]#!/bin/bash
# scripts/upload.sh
aws s3 cp "$BINO_OUTPUT_DIR"/*.pdf \
"s3://client-reports/${CLIENT_ID}/$(date +%Y-%m)/"See also: Multi-region dashboard recipe for parameterized page templates, and Data from databases for connection details.